Friday, May 27, 2022

When asked to name the greatest invention in human history, Albert Einstein simply replied “compound interest.”

Albert Einstein is also credited with saying: “Compound interest is the 8th wonder of the world. He who understands it, earns it; he who doesn’t, pays it.”

Compound interest or compounded returns is when your money makes money on previous returns or earns interest on interest. The compound interest formula is calculated by multiplying the principal amount by one plus the annual interest rate by the power of the number of periods the capital will be compounding at to get a total figure for both the principal and what accrues through compound interest. Subtract the principal if you just want the compound interest results.

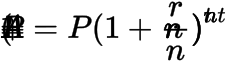
Here is the exact compound interest formula  that can used for calculating it:

A = P(1 + \frac{r}{n})^{nt}

Formula answer key:
A = Final amount
P = Initial principal balance
r = Interest rate
n = Number of times interest applied per time period
t = Number of time periods elapsed

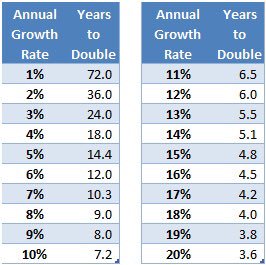
Here is the rate of compounding on capital based on annual return rate:

 compound interest formula
Years it takes capital to double based on annual growth rate

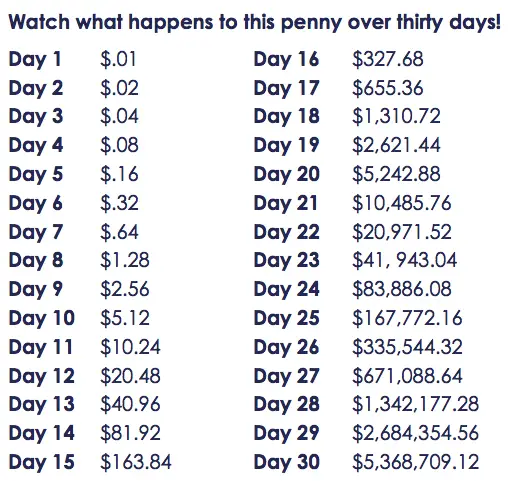
Here is the compounded returns when you double a penny for 30 days:

double a penny for 30 days
What you have after you double a penny for 30 days.

One of the most powerful thing you can do is grow capital by compounding it year over year and allowing it to grow to astounding levels. 

Thursday, March 17, 2022

This music can listen forever! Sergey Chekalin! Divine, Unsurpassed musi...

Market had "Follow Thru" Day March 16th close of trading day.

We may have finally reached the bottom of the market.

Be cautious entering the market since major indexes are still below the 50 day sma.

Start out dipping your toes with minor test position in leading stocks for now.


Enjoy the music while you are scanning stocks that may be the next crop of Leading Stocks.

Buy High n Sell Higher. Don't be looking for stocks that r trading below 50 day sma.

Sunday, August 29, 2021


Our Criteria for Selecting Growth Stocks


Almost 7 years ago we at  "Investorspotlight"  started on a journey to empower Retail traders and investors to take control of their financial future.  We developed a Mentoring/Coaching program to take the mystery out of trading and investing in the stock market.  We got involved with the IBD (Investors Business Daily) Meetup group in the local Tampa Bay area to share our methodology with the local investors and traders.  In the process we learnt and solidified our own understandings of the IBD CANSLIM system.  Follow me on tweeter  @ "spotlightamin"  where I tweet daily on stocks of interest and stock market content that I find worth reading.    


Here is a short video that we developed 7 years ago to briefly highlight our minimum criteria for selecting Growth Stocks and establishing loss and profit targets for each of the stocks we take a position on.  We have fine tuned our system over the last several years but our foundation is highlighted in this short video.  We are hoping you will review it and comment on it and give us the feed back.  We hope you benefit from our expertise and over 25 years that we have spent trading and investing in Growth Stocks.


Passcode : spot0816 to view the video


Building a Watchlist and Planning a Trade -


Happy Trading


Amin (investorspotlight@gmail.com) 

Sunday, August 22, 2021

Master the CANSLIM Strategy


C A N S L I M


Investors Business Daily (IBD) system of investing and trading growth stocks can result in attaning gains of 2 to 2 and 1/2 times better than the general market - utilizing the performance of the  $SPY  as a proxy for the performance of the general market.  Here is an excellent video by Richard Moglen who goes into the details of the highlights of IBD system of trading growth stocks.  


Review it on a regular basis to keep you grounded to the system.  We have been in a bullish trend since February of 2016 with minor pull backs of 3% to 8%  along the way.  That is perfectly normal and something every growth stock investors looks for.  Minor corrections helps shake out the weak holders of stocks.  It also helps set up new bases for stocks to take a breather and set up for the next move higher.  


August and September months are traditionally some of our  weakest months in the market.  It's hard to make progress with your portfolio when the market is volatile as it has been for the last couple of weeks.  Don't be dismayed though.  Observe the strict rules of mitigating risk and dispose of stocks that are not making much progress.  It's best to conserve  CASH   right now and harvest partial profits in stocks that have attained gains of  +20%  to  +25%.   Our best months in the market tends to be between November through April.  History suggests that if the market is up the first 6 months of the year, than the latter 1/2 of the year will also have a positive performance.  Have the  CASH  available in your account to take the advantage of rally in the Fall.


Happy Trading !

Amin

Sunday, August 8, 2021

 Growth Stock Investing


IBD (Investors Business Daily) system of investing and trading growth stocks is one of the best ways to double your portfolio.  IBD studies has shown that adhering to their CANSLIM system, one can attain gains of 2 to 2 and 1/2 times than what one would attain investing in the general market using $SPY as a proxy of the performance of the general market.  It's a system that one can learn and master.  It requires discipline and following the the rules of the system.  


Market is currently in a  'Confirmed Uptrend'.  Although the coast is clear for making additional buys on your existing stocks or to initiate new positions right now, just be aware that the market is not making much progress right now.  Personally I started migrating to  CASH  over 6 weeks ago.  Although the major indexes - $SPY  and the  $QQQ  are trading above the 21 day ema(exponential moving average), they are pretty much extended from the 50 day sma(simple moving average).  Market retracing -5% to -10%  with low volume trading during the summer months of August and September would be quite normal.  This is not a prediction but we know these are some of the poor performing months in the market traditionally.  Let the stock charts tell you the story and let the data drive your decisions.


This is probably a good time for us all to polish up our skills of trading, review our past trades to see where we made mistakes and learn from it.  Learn to decipher stock charts and master the skills of identifying the ideal buy and sell signals that stock charts flash at you.  Currently IBD is offering huge discounts on their Home Study courses.  I have taken several of those courses over the years - and some of them I attended several times when they were presented live.  I would strongly recommend the following online courses to start your mastery of the IBD system.  Having an IBD subscription is a good start and these courses will certainly speed up your learning curve.  I know it certainly did that for me and I continue to look over my notes and the booklet they provided on a regular basis to keep me grounded to the system. 

IBD Digital Home Study Courses:

Level 1 ... $299 (50% off now for $149)
Level 2 ... $799 (30% off now for $549)
Level 3 ... $999 (30% off now for $695)

For less than $1,400 (1/3 off from $2097) you can build a starting library to learn the IBD system of Growth Stock Investing. 


Level 1 Video


Ken Shreve - author at IBD used to teach level 1 course live on a regular basis.  Currently he appears regularly on IBD live discussing stocks of interest during the first hour of the market.  He also appears regularly during the daily IBD segment of end of the day market analysis.  Here is a link to the short video he produced highlighting the Level 1 course.  One needs to master deciphering the bases that all stocks go through before they make their bid higher.


https://youtu.be/UiYSRX-AKBU


Good luck trading this week.

Amin
Sunday, July 25, 2021

 $GNRC


This is an institutional quality stock that has been appearing on IBD 50 screen for the past year.  It used to be a stock ranging in price between $50 and $60 just 2 years ago and trading less than 500,000 shares per day (less than $60 million ... share price x volume of shares traded per day).  Most institutions prefer to trade stocks that trade $100 million or more per day.  They prefer very liquid stocks because not only do they have deep pockets to acquire several billions of $$$ in their stocks of choice but also because very liquid stocks offer them the opportunity to trade very liquid options on the stock.


During the week of February 10th 2020, the stock shot up in price by +10% within 4 days of heavy trading volume.  Over $2.5 billion of trading occurred within 4 days with trading volume that had shot up by 15 times the daily average trading volume on February 12th.  This ought to get any traders attention when one notices such a huge spike in the sheer volume of shares exchanging hands.  Within 3 months (end of June) the stock had moved up from $117 to $193 (+65% move).  This stock immediately got on my radar and kept it on my watch list.  Patience is the key.  It takes a lot of time for the stock to digest these massive  gains.  Institutions normally take a breather after making such a huge run in price.


Here is a short synopsis of How I handled this stock to profit handsomely utilizing the basic IBD (Investors Business Daily) rules that Mr. William J O'Neil practices.


  1. Oct 28 2020 ... Stock breaks out from its consolidation of 208.26 as a pivot identified on my chart.
  2. Oct 30th 2020 ... Established an initial position @ $213.99 (It's + 110% as of Friday July 23rd)
  3. Nov 12th 2020 ... Added additional position @ $224.30 (It's +100% as of Friday July 23rd)
  4. Feb 11th 2021 ... Stock breaks out from $287.55 as a pivot identified on my chart.  It rises +20% within days - triggering the "8 Week Hold Rule".  This is a confirmation and a sign that the institutions are deeply committed to acquiring this stock.  
  5. Identified $330.31 as a support/resistance area on my trading platform to alert me.
  6. Stock consolidated for 3 months - Mar/Apr/May - to digest the gains of +300%  since its initial run from Feb 2020.  Several small positions were added between $300 and $325 to concentrate the portfolio to just a few leading stocks.
  7. June 8th 2021 ... Stock breaks out from  $331.31 in volume of 3 times the average trading volume of the stock.  One can see the 8 day ema(exponential moving average) separating away from the 21 day ema and the stock making its run higher.  It never looked back.  The stock never corrected much while the market went into correction a week before.
  8. Currently the stock is hovering around $440 identified as a 3 weeks flat base on my platform.  Earnings is due this week.  The last few additions to stock positions (additions made from $300 to $325)  were closed down for +40% profits.  
  9. Stock is currently extended from its 50 day sma (simple moving average).  There is a lot of  "White Space"  between the 8 day ema and the 50 day ema.  Similar situation occurred on Feb 22nd when the stock made a gain of over +20% and triggered the "8 week Hold Rule".  History of the stock indicates that the stock tends to consolidate its gains after such a massive move.

Stock will be evaluated after the earnings are reported later this week.  It would be best for the stock to consolidate and form a new base from which to propel higher.  I am looking for the 50 day sma to catch up to the 21 day ema and fill up that space closer to the 21 day ema.


I hope this post helps you in identifying the leading stocks utilizing the IBD screens effectively.  Building a good stock watch list and annotating your stock charts would help you to track stocks that are of institutional quality.  Mitigating risk by harvesting profits prior to earnings is a good strategy to follow as well.  Patience is the key when you are monitoring stocks that are on your watch list.  Success of profiting in a leading stock is all about waiting for the right set up to increase the odds of a successful and a profitable trade.


Happy Trading this week.

Market tone has been updated by IBD to  "Market in Confirmed Uptrend".  It's a sign to start rebuilding your portfolio with new leading stocks or adding to the existing stocks in your portfolio with additional buys.  


Amin (investorspotlight@gmail.com)  


Market is acting Bullish - inspite of Iran/Israel Conflict

Leading Stocks That I Monitor This Week June 16th to June 20th   Possible Buy Points (in parenthesis) to Initiate or Scale into Position  1....